A website health report gives your site an overall score out of 100, a letter grade, and six category scores: performance, security, SEO, accessibility, privacy and mobile. The overall score is a weighted average of the six. Read it from the top down: check the grade, find the weakest category, fix the items in "Fix these first", then use Core Web Vitals to judge real-world speed.
This guide explains every part of a report from our free website health check, using a real report for example.com (the domain reserved for documentation) so you can follow along with your own.
Key takeaways
- The overall score weights performance 25%, security 20%, SEO 20%, accessibility 15%, privacy 10% and mobile 10%.
- Issues are labelled critical or warning and rated high, medium or low impact. Fix high-impact critical items first.
- Core Web Vitals use Google's thresholds: LCP under 2.5 s, INP under 200 ms and CLS under 0.1 are "good".
- Real-user data (when available) reflects what Google uses for ranking; lab data is a consistent simulation for diagnosing problems.
The overall score and grade
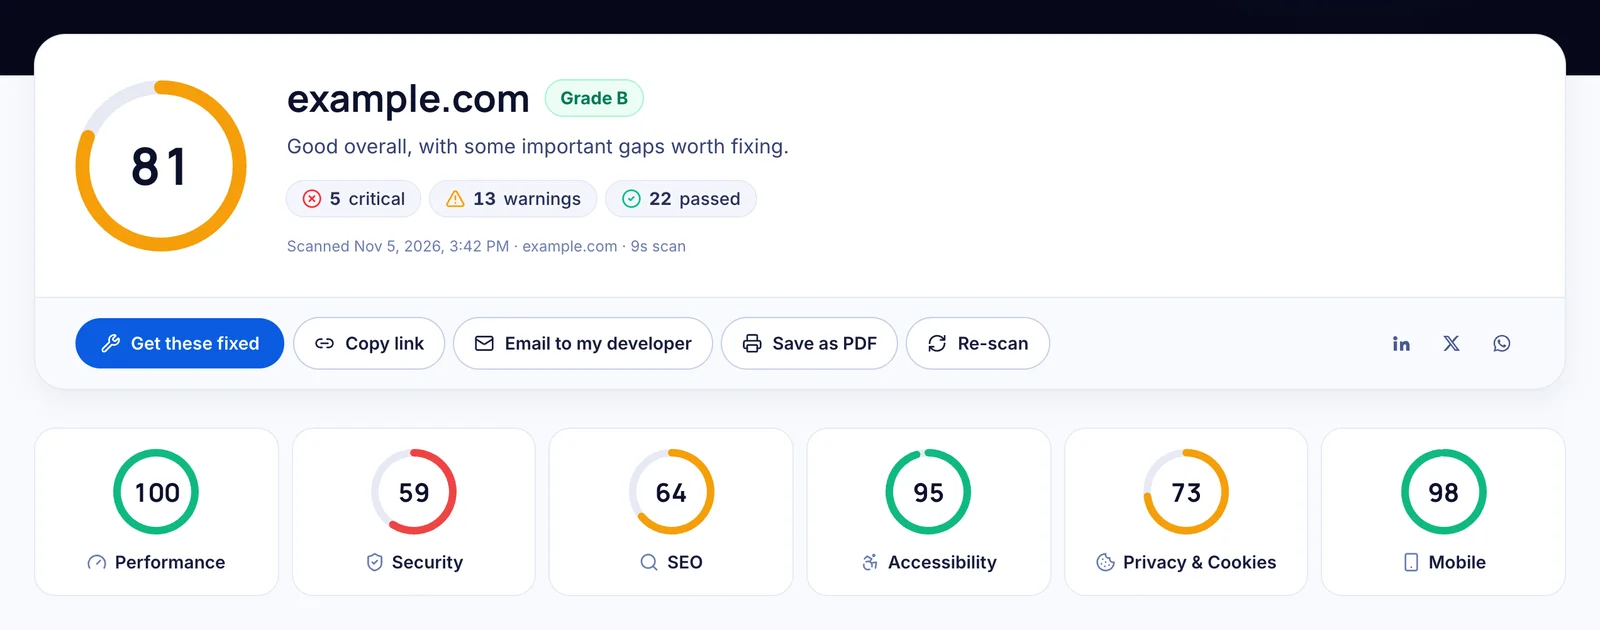
The big ring is your overall score. It's calculated as a weighted average of the six category scores, so a weak category drags it down in proportion to its importance:
| Category | Weight | Why it's weighted this way |
|---|---|---|
| Performance | 25% | Speed affects every visitor, conversions and Google rankings |
| Security | 20% | Security problems damage trust and can be exploited |
| SEO | 20% | If search engines can't index or understand you, you can't be found |
| Accessibility | 15% | Barriers exclude customers and create legal risk |
| Privacy & cookies | 10% | Compliance gaps carry regulatory risk |
| Mobile | 10% | Most visits are on phones; Google indexes mobile first |
The grade translates the score into plain terms: A (90+) excellent, B (80–89) good with gaps, C (70–79) fair, D (55–69) needs work, F (below 55) poor.
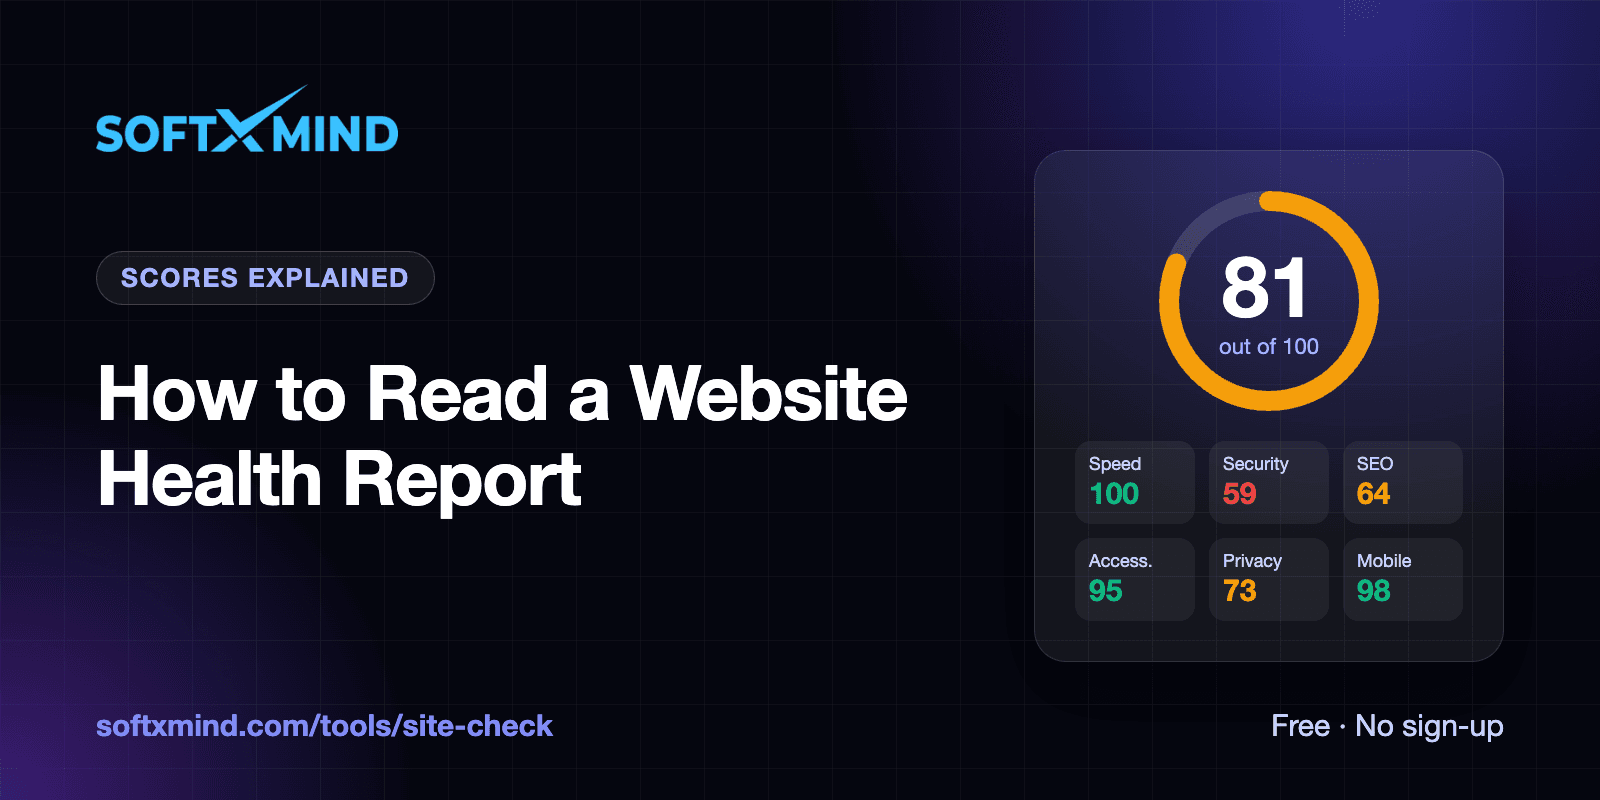
In the example, example.com scores 81 (B). Performance (100) and mobile (98) are excellent, but security (59) and SEO (64) pull the total down. That tells you exactly where to focus.
Critical issues, warnings and passed checks
Under the domain name you'll see three counts:
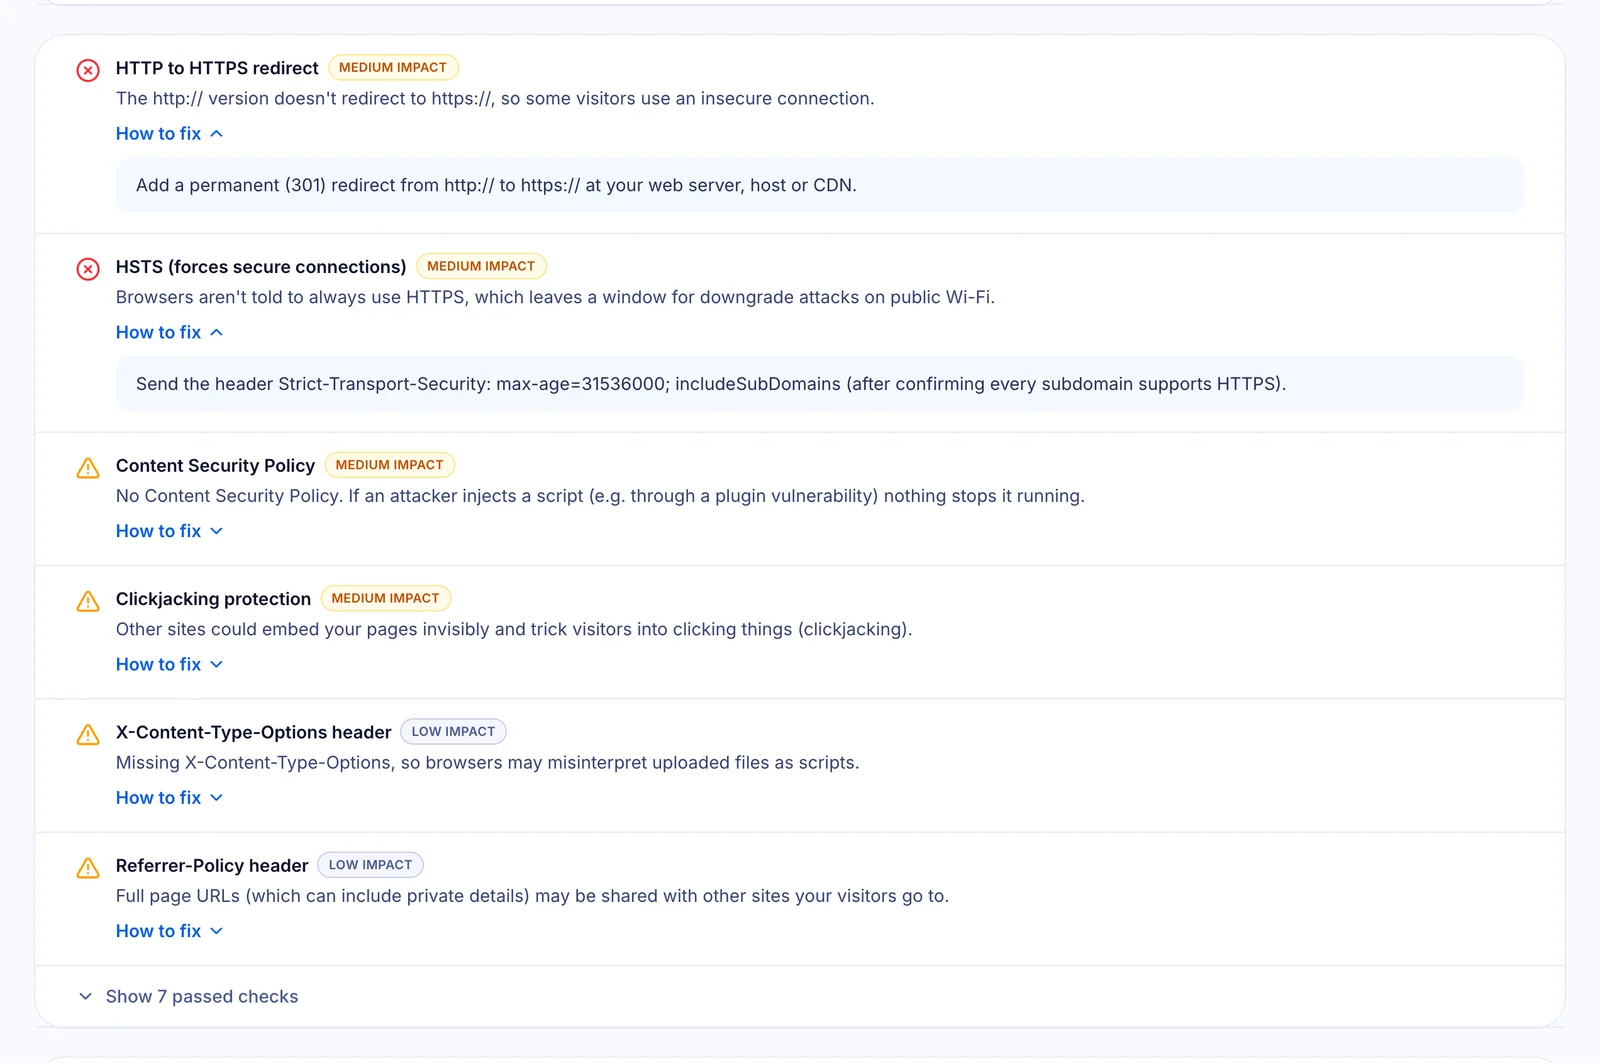
- Critical: checks that failed outright, such as no privacy policy or no HTTPS redirect.
- Warnings: checks that partly pass or could be improved, such as a meta description that's too long.
- Passed: checks your site already meets.
Every failed or warning item also has an impact level. High impact items affect security, visibility or compliance directly. Medium items are worth scheduling soon. Low items are polish.
"Fix these first": your action plan
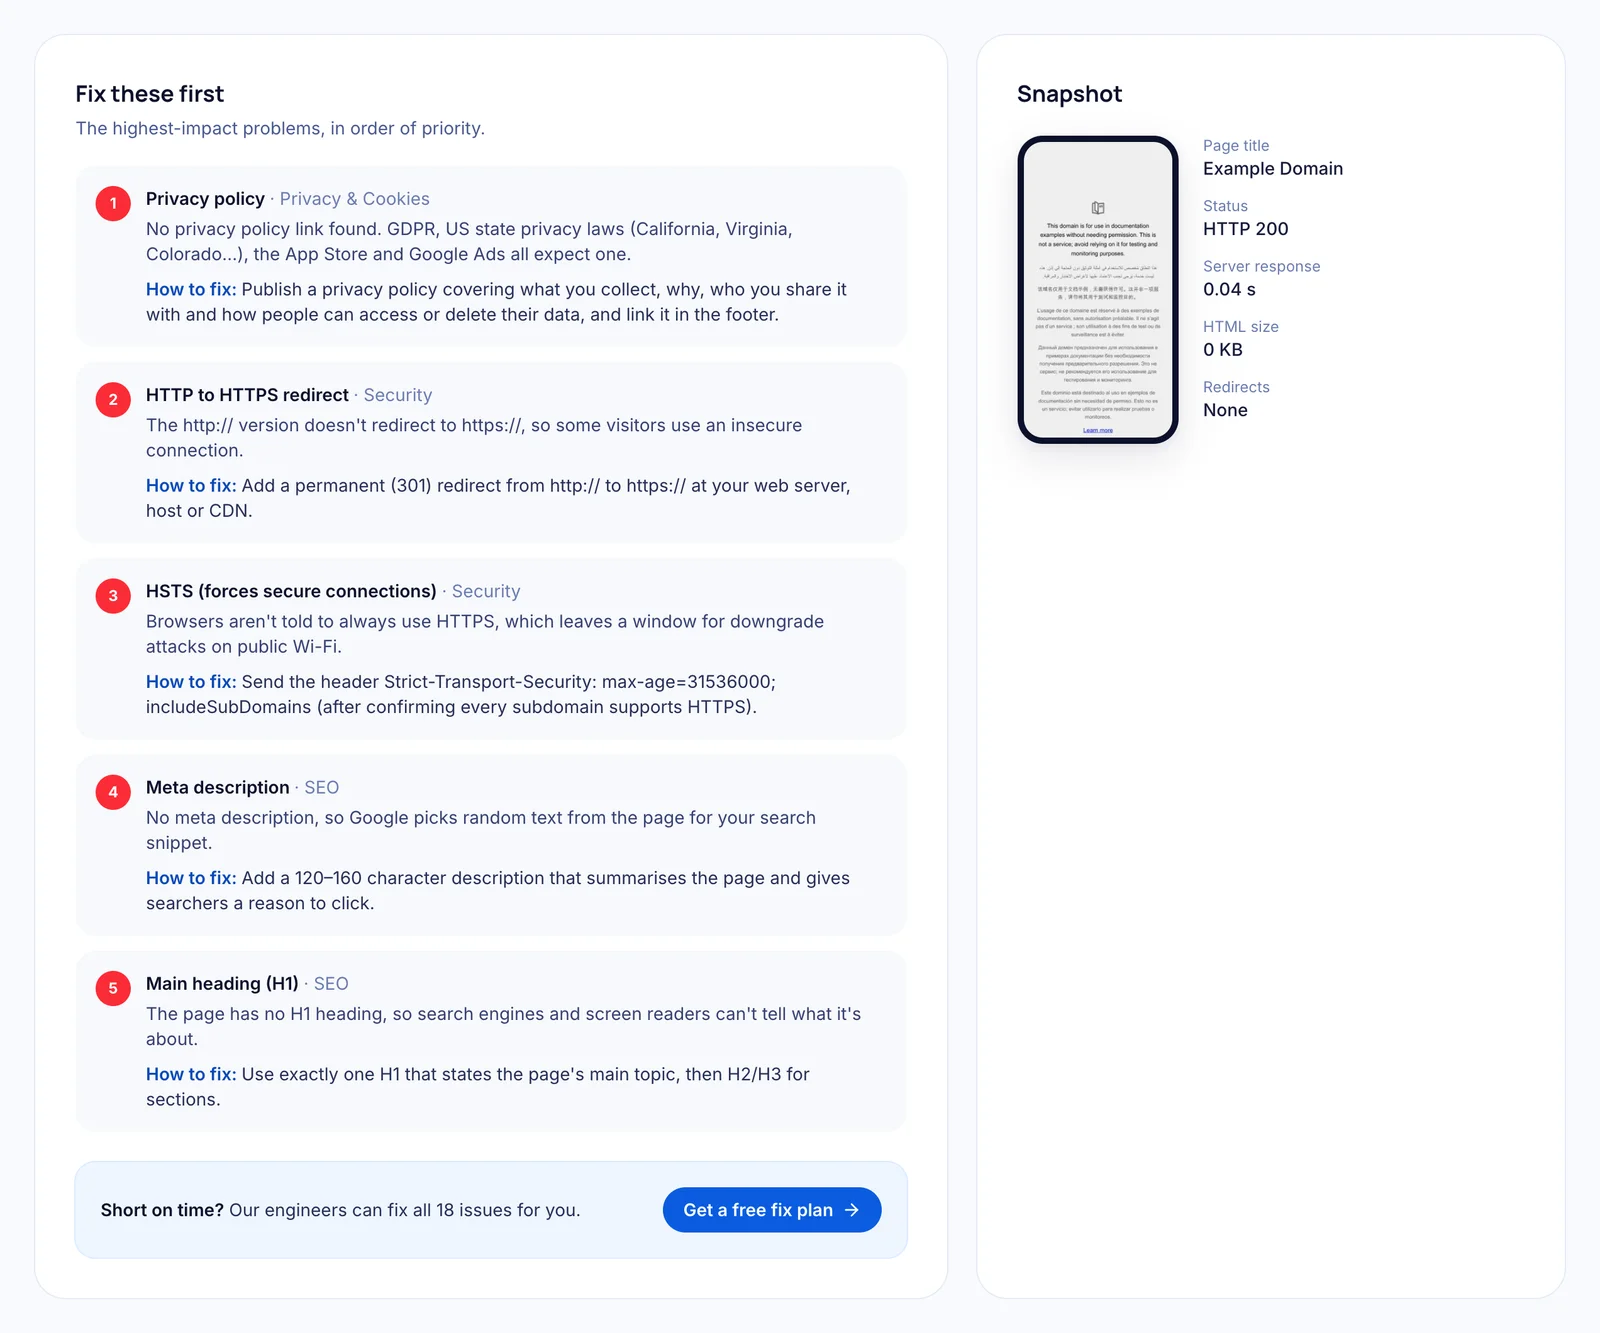
This panel ranks your five most important problems: failures before warnings, high impact before low. Each entry explains what we found and how to fix it. If you only have time for five changes this week, make these.
The Snapshot beside it shows how your homepage looks on a phone, along with the page title, HTTP status, server response time, HTML size and redirect count.
Understanding Core Web Vitals
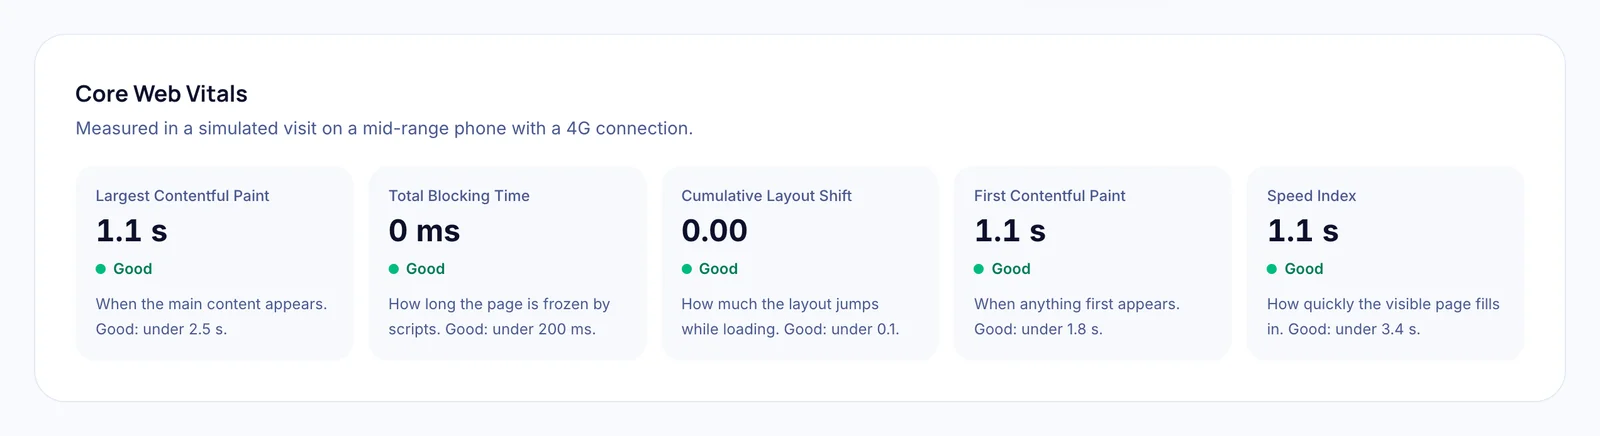
Core Web Vitals are Google's measures of real-world page experience. Here's what each metric means and the thresholds Google uses:
| Metric | What it measures | Good | Poor |
|---|---|---|---|
| Largest Contentful Paint (LCP) | When the main content appears | ≤ 2.5 s | > 4.0 s |
| Interaction to Next Paint (INP) | How quickly the page reacts to taps and clicks | ≤ 200 ms | > 500 ms |
| Cumulative Layout Shift (CLS) | How much the layout jumps while loading | ≤ 0.1 | > 0.25 |
| First Contentful Paint (FCP) | When anything first appears | ≤ 1.8 s | > 3.0 s |
| Total Blocking Time (TBT) | How long scripts freeze the page (lab stand-in for INP) | ≤ 200 ms | > 600 ms |
| Speed Index | How quickly the visible page fills in | ≤ 3.4 s | > 5.8 s |
LCP, INP and CLS are the three official Core Web Vitals. FCP, TBT and Speed Index are supporting lab metrics that help diagnose why a page feels slow. Google's own documentation on Web Vitals goes deeper.
Real-user data vs lab data
The panel tells you which kind of data you're looking at:
- Real-world data comes from Chrome users who visited your page over the last 28 days. This is what Google uses for ranking, but it's only available for pages with enough traffic.
- Lab data comes from a simulated visit on a mid-range phone with a 4G connection. It's consistent and great for diagnosing problems, but varies by a few points between runs.
Reading each category
Below the summary, every check is grouped by category, with issues first and passed checks collapsed. Here's what each category covers and what tends to go wrong:
- Performance: the Lighthouse mobile score plus the biggest speed opportunities (only those worth at least 0.3 seconds), server response time, compression and page weight.
- Security: HTTPS, the certificate, encryption version, protective headers, mixed content, cookie flags and email spoofing protection. Missing security headers are the most common failure.
- SEO: status code, indexability, title, description, headings, canonical, robots.txt, sitemap, structured data and social previews.
- Accessibility: our own checks combined with Google Lighthouse's automated audit, covering contrast, labels, alt text, names and tap targets.
- Privacy & cookies: trackers detected, consent before tracking, tracking cookies set too early, and the policy and opt-out links privacy laws expect.
- Mobile: viewport, zoom, responsive images, home-screen icon and the mobile speed score.
The full list of what's tested, with targets for each item, is in our website health checklist.
What a perfect report looks like
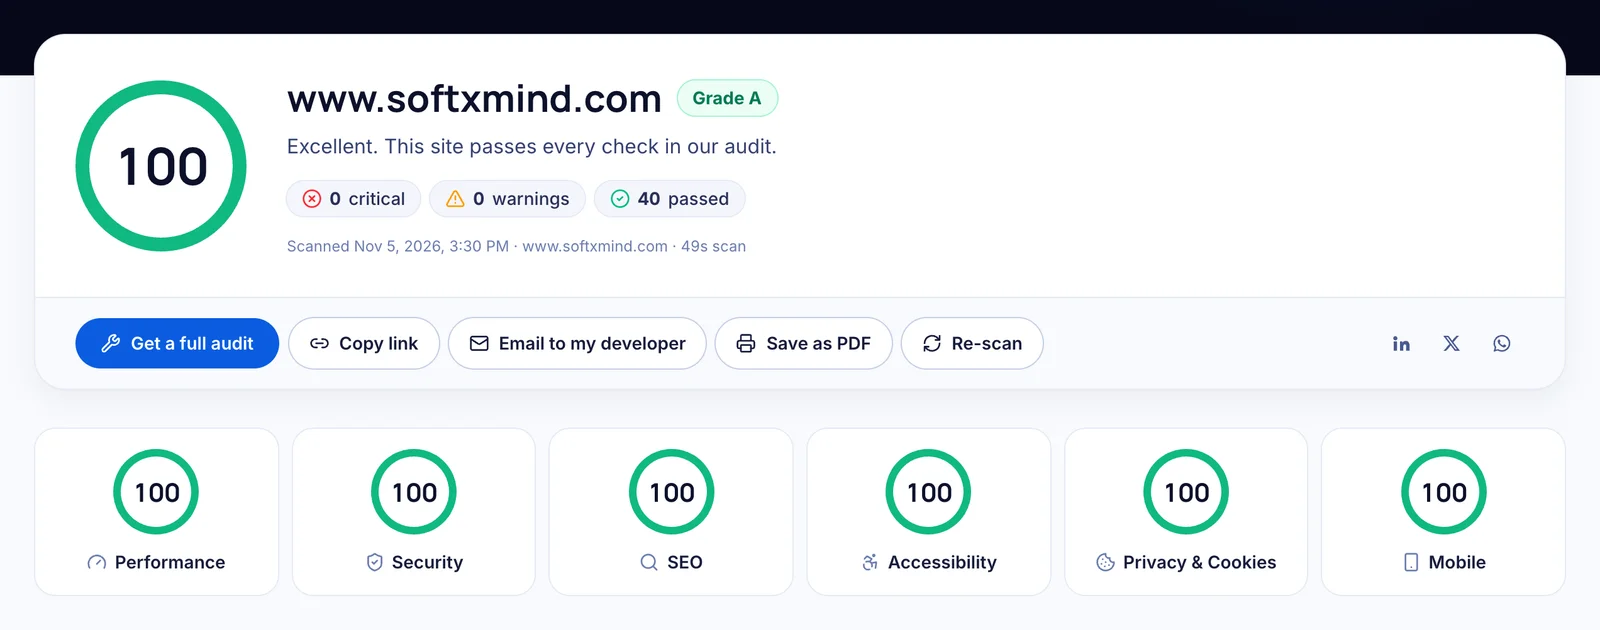
A perfect score is achievable. Our own site went from 81 to 100 in a day. Read exactly what we changed.
Frequently asked questions
How is the overall website health score calculated?
It's a weighted average of six category scores: performance 25%, security 20%, SEO 20%, accessibility 15%, privacy 10% and mobile 10%. Categories that couldn't be measured are left out and the rest re-weighted.
Why does the performance score say "Not measured"?
Occasionally Google's speed test can't complete, for example if the site blocks it or the service is busy. The rest of the report is still valid; re-scan after a minute to get the performance score.
What's the difference between a critical issue and a warning?
A critical issue is a check that failed outright. A warning means the check partly passed or could be improved. Both are shown with an impact level so you can prioritise.
Is a score of 80 good?
80–89 is grade B: good overall, but with gaps worth fixing. Look at the lowest category and the "Fix these first" list to see what would move you into the 90s.
Can I share or save my report?
Yes. Every report has its own link you can copy, email or share on social media, and you can save it as a PDF from the toolbar.
See your own report: run a free website health check in about 30 seconds.